Some familiarity with JavaScript (or a language like it) would be useful in understanding the below.
Getting set up
In order to use the Google Maps API you’ll need to get an API key. It’s a string of letters, numbers and punctuation used to represent a unique identifier tied to your Google account. Note it’s not permanent - you can generate as many of those as you want.
Sign in to Google APIs and create a project. Go to ‘Dashboard’ and select ‘Google Maps JavaScript API’ - this will enable the API for your project. There should be a wizard for you to create a key right there and then. If not, go to ‘Credentials’ on the left-hand side and create a new one.
API keys can be restricted in a number of ways - for instance you can tie it to an IP address - so requested with the key but coming from a different address will be ignored (and more crucially, not count towards your quota). I actually created 2 keys - one private (unrestricted - which will be flagged with a little warning triangle) for local development and one I intend to use specifically from this domain/GitHub. More information on best practices can be found here.
A (blank) map
We’ll create a page filled with the map. All it takes for this to work is to work is to import the Google Maps API:
<!DOCTYPE html>
<html>
  <head>
    <style>
       #map {
        height: 400px;
        width: 100%;
       }
    </style>
  </head>
  <body>
    <div id="map"></div>
    <script>
      function initMap() {
        new google.maps.Map(document.getElementById('map'), {});
      }
    </script>
    <script async defer
    src="https://maps.googleapis.com/maps/api/js?key=YOUR_API_KEY&callback=initMap">
    </script>
  </body>
</html>
You’ll note we pass in the callback=initMap parameter - this is what gets called once the API is loaded - at which point you can initialise your map.
Okay that’s a little boring with nothing to see. Let’s pass in a zoom level and centre the map around the 0,0 coordinate.
function initMap() {
  new google.maps.Map(document.getElementById('map'), {
    zoom: 5,
    center: {lat: 0.0, lng: 0.0}
  });
}
Adding markers to the map
Google’s API allows you to easily drop markers on a map. According to Wikipedia, Big Ben is located at 51°3’2.72’‘N 00°0’28.78’’. This locatio iin the WGS84 format. You can convert this to decimal yourself or using an online tool, which is 51.5007556, -0.1246611.
function initMap() {
  var map = new google.maps.Map(document.getElementById('map'), {
    zoom: 1,
    center: {lat:0, lng: 0}
  });
  var bigben = {lat: 51.5007556, lng: -0.124661};
  var marker = new google.maps.Marker({
    position: bigben,
    map: map,
    title: 'Big Ben!'
  });
}
All we did was pass in a position, a map (as you may have several), and a tooltip.
The marker can be customised in a number of ways. This is particularly useful if we want to have different kinds of markers.
Wiring it up
We’ll leverage the above with Bixi, a bike-sharing scheme in Canada. Bixi provides access to its data, namely the number of free bicycle spaces at each of its sharing stations.
Due to the CORS (cross-origin resource sharing) restrictions, we can’t fetch this as part of the webpage itself. Instead we’ll write a quick Python script to extract a handful of markers.
>>> import urllib.request, json
>>> url = 'https://secure.bixi.com/data/stations.json'
>>> data = json.loads(urllib.request.urlopen(url).read().decode('utf-8'))
>>> len(data['stations'])
419
>>> def iconType(slots):return next((colour for numSlots,colour in [(1, 'red'),(10,'purple'),(200,'green')] if slots < numSlots))
...
>>> iconType(0)
'red'
>>> iconType(23)
'green'
>>> def getMarkerText(station): return '{{position: new google.maps.LatLng({lat},{lng}), colour: "{colour}", tooltip: "{tt}"}}'.format(lat=station['la'],lng=station['lo'],colour=iconType(station['da']),tt=station['s'])
...
>>> getMarkerText(data['stations'][0])
{position: new google.maps.LatLng(45.52604347726228,-73.54896068572998), colour: "red", tooltip: "Parthenais/Ste-Catherine"}
Let’s randomly select a few:
>>> import random
>>> stationIDs = [random.randint(0,len(data['stations'])) for _ in range(10)]
>>> print(',\n'.join(getMarkerText(data['stations'][x]) for x in stationIDs))
{position: new google.maps.LatLng(45.54176571696572,-73.62612783908844), colour: "green", tooltip: "Gounod / Saint-Denis"},
{position: new google.maps.LatLng(45.52114,-73.54926), colour: "green", tooltip: "RenLesque / Papineau"},
{position: new google.maps.LatLng(45.477313,-73.615327), colour: "green", tooltip: "Ave Notre Dame de Gre / Darie"},
{position: new google.maps.LatLng(45.50233,-73.566497), colour: "green", tooltip: "Union/RenLesque"},
{position: new google.maps.LatLng(45.462742,-73.565845), colour: "purple", tooltip: "Ross / Ave de Llise"},
{position: new google.maps.LatLng(45.544377,-73.581018), colour: "green", tooltip: "Parc Rosemont (Dandurand/d'Iberville)"},
{position: new google.maps.LatLng(45.53702583434782,-73.59316617250443), colour: "green", tooltip: "Parc Pe-Marquette (Chambord / Rosemont)"},
{position: new google.maps.LatLng(45.546978,-73.575515), colour: "red", tooltip: "4e Avenue / Masson"},
{position: new google.maps.LatLng(45.477249,-73.587238), colour: "green", tooltip: "Metro Place St-Henri (St-Ferdinand/St-Jacques)"},
{position: new google.maps.LatLng(45.53696,-73.61199), colour: "purple", tooltip: "Banger / Saint-Denis"}
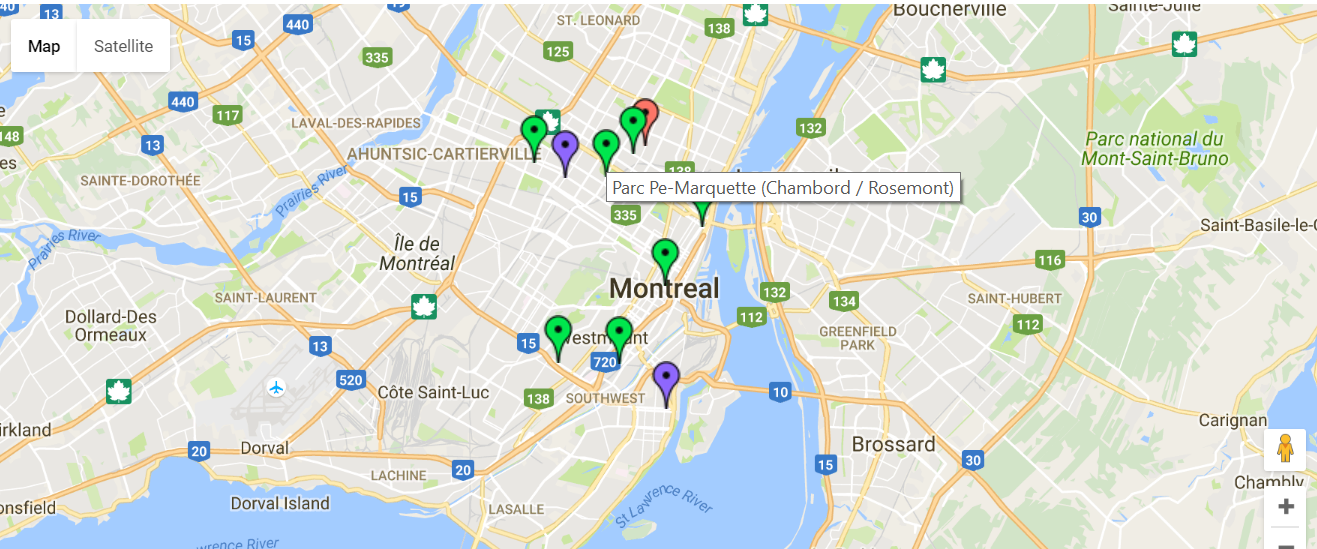
We added a colour attribute to highlight the availability. We’ll copy-paste the output into an array and iterate through each, adding a marker as we go.
function initMap() {
    var map = new google.maps.Map(document.getElementById('map'), {
          zoom: 11,
          center: {lat: 45.496111, lng: -73.569444} // Centre Bell
        });

    var stations = [
      {position: new google.maps.LatLng(45.54176571696572,-73.62612783908844), colour: "green", tooltip: "Gounod / Saint-Denis"},
      {position: new google.maps.LatLng(45.52114,-73.54926), colour: "green", tooltip: "RenLesque / Papineau"},
      {position: new google.maps.LatLng(45.477313,-73.615327), colour: "green", tooltip: "Ave Notre Dame de Gre / Darie"},
      {position: new google.maps.LatLng(45.50233,-73.566497), colour: "green", tooltip: "Union/RenLesque"},
      {position: new google.maps.LatLng(45.462742,-73.565845), colour: "purple", tooltip: "Ross / Ave de Llise"},
      {position: new google.maps.LatLng(45.544377,-73.581018), colour: "green", tooltip: "Parc Rosemont (Dandurand/d'Iberville)"},
      {position: new google.maps.LatLng(45.53702583434782,-73.59316617250443), colour: "green", tooltip: "Parc Pe-Marquette (Chambord / Rosemont)"},
      {position: new google.maps.LatLng(45.546978,-73.575515), colour: "red", tooltip: "4e Avenue / Masson"},
      {position: new google.maps.LatLng(45.477249,-73.587238), colour: "green", tooltip: "Metro Place St-Henri (St-Ferdinand/St-Jacques)"},
      {position: new google.maps.LatLng(45.53696,-73.61199), colour: "purple", tooltip: "Banger / Saint-Denis"}
    ];

    var icons = {
      red:  "http://maps.google.com/mapfiles/ms/icons/red-dot.png",
      purple: "http://maps.google.com/mapfiles/ms/icons/purple-dot.png",
      green:  "http://maps.google.com/mapfiles/ms/icons/green-dot.png"
    };

    function placeMarker(station) {
      new google.maps.Marker({
        position: station.position,
        icon: icons[station.colour],
        map: map,
        title: station.tooltip
        });
      }

    for (var i = 0, station; station = stations[i]; i++) {
      placeMarker(station);
    }
  }
And voila!
That was a lot more straight-forward than anticipated. You can see the full code here (though note you’ll want to use your API key if you want to run that locally).
KML
TBC
References
- Google Maps API reference
- Custom markers
- Click events (not implemented in the above, just something to look into)